The FIFA World Cup 2026™ experience won’t start when the first whistle of the tournament blows – it will start online.
With the FIFA World Cup 2026™ set to be the largest tournament in history, featuring 48 teams for the first time, digital infrastructure will face its biggest test yet. As fans turn to federation websites and sponsor campaign pages for everything from fixtures and tickets to live updates, streaming content and merchandise, these digital touchpoints will play a critical role in shaping the fan journey. However, new analysis from Dynatrace suggests that many may not be ready for the surge in demand.
National football federation websites show major performance gaps
The research, which analyzed synthetic monitoring data from official football federation web properties across all 48 participating nations, found fans are waiting almost six seconds on average for pages to load. While some countries deliver fast, seamless digital experiences for supporters, others risk leaving fans waiting more than 50 seconds for pages to fully load.
At the bottom of the rankings, DR Congo recorded the slowest average page load time at 57.5 seconds, meaning fans could wait nearly a full minute for pages to load. Uzbekistan followed at 30.8 seconds, while Saudi Arabia (13.2 seconds), Haiti (12.0 seconds) and Algeria (9.8 seconds) also ranked among the slowest-performing digital experiences of the countries participating in the tournament.
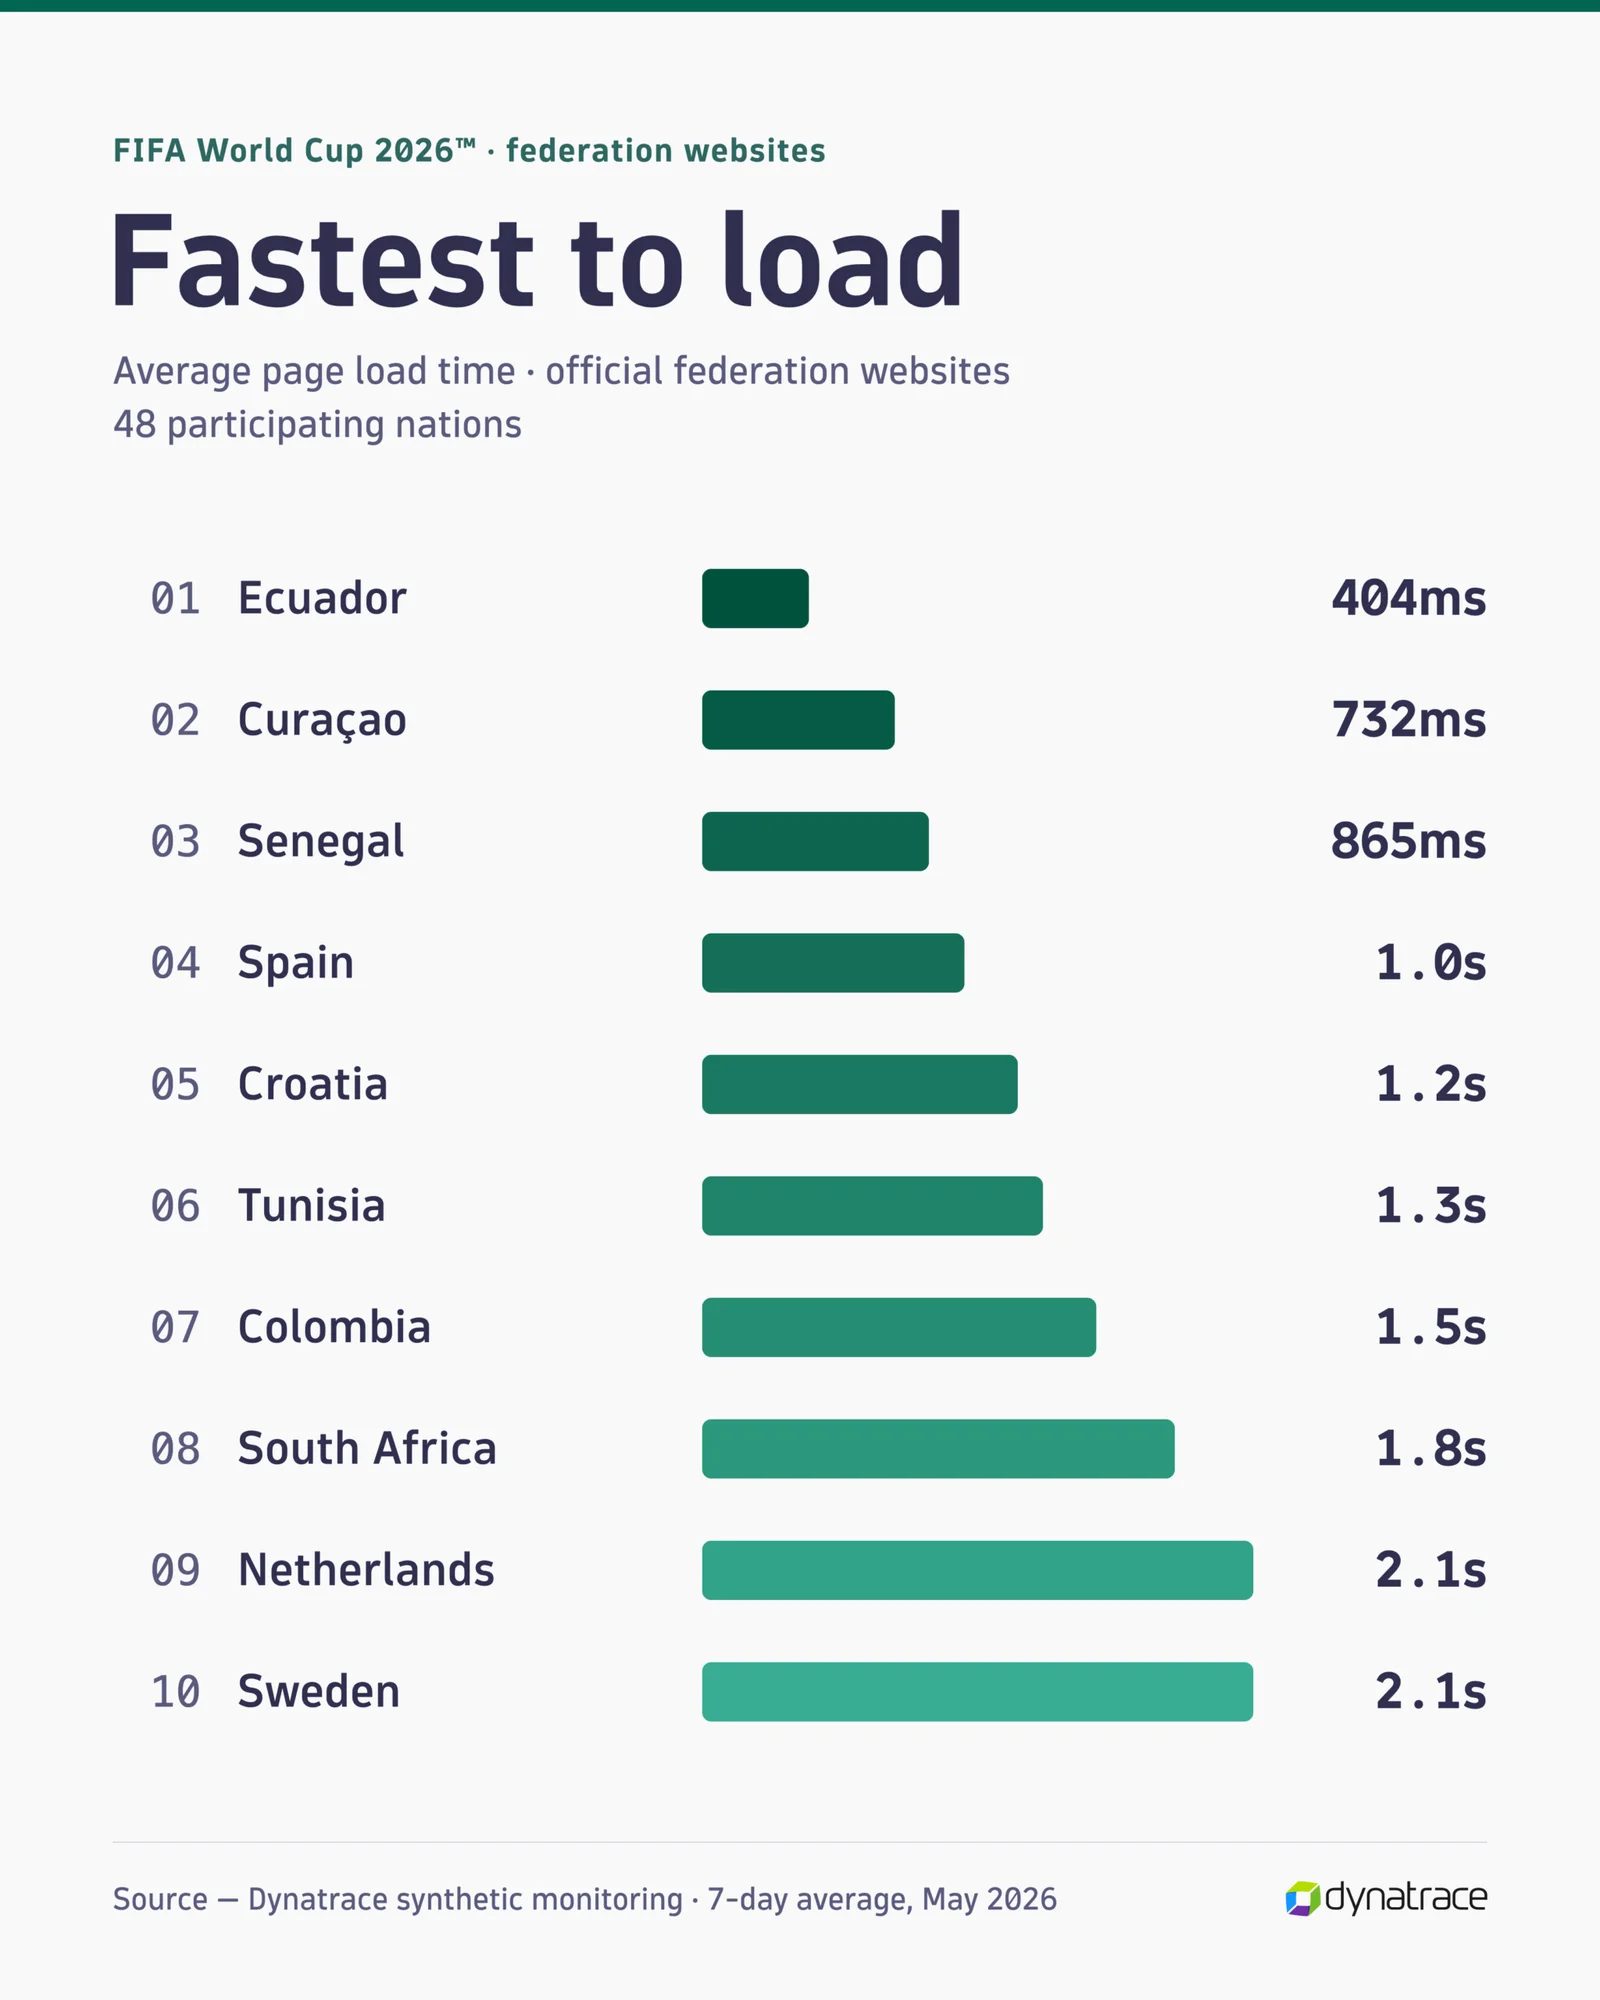
In contrast, Ecuador delivered the fastest average load time at just 404ms, followed by Curaçao (732ms), Senegal (865ms) and Spain (1 second).
The data also revealed that some of the world’s biggest nations struggled to maintain strong digital performance. Five-time world champions Brazil appeared in the bottom 10, with an average page load time of 5.7 seconds, while Saudi Arabia also ranked among the slowest-performing sites at 13.2 seconds.
Average page load time: Slowest-performing FIFA World Cup 2026™ nation websites
| Ranking | Nation | Average page load time |
| 1 | DR Congo | 57.5 seconds |
| 2 | Uzbekistan | 30.8 seconds |
| 3 | Saudi Arabia | 13.2 seconds |
| 4 | Haiti | 12.0 seconds |
| 5 | Algeria | 9.8 seconds |
| 6 | United States | 9.7 seconds |
| 7 | Jordan | 8.7 seconds |
| 8 | Iraq | 8.4 seconds |
| 9 | Turkey | 8.4 seconds |
| 10 | Brazil | 5.7 seconds |
Average page load time: Best-performing FIFA World Cup 2026™ nation websites
| Ranking | Nation | Average page load time |
| 1 | Ecuador | 404ms |
| 2 | Curaçao | 732ms |
| 3 | Senegal | 865ms |
| 4 | Spain | 1.0 second |
| 5 | Croatia | 1.2 seconds |
| 6 | Tunisia | 1.3 seconds |
| 7 | Colombia | 1.5 seconds |
| 8 | South Africa | 1.8 seconds |
| 9 | Netherlands | 2.1 seconds |
| 10 | Sweden | 2.1 seconds |
The analysis found that many of the slowest-performing federation websites shared common issues, including image-heavy pages, high numbers of content requests, and inefficient loading of page assets. Notably, the United States – one of the FIFA World Cup 2026™ host nations – ranked as the sixth slowest-performing federation website, with an average page load time of 9.7 seconds. Analysis of the site suggests performance was impacted by the volume of content being loaded and the number of requests required to render pages, demonstrating how even major football federation websites can be affected by digital performance challenges.
Global World Cup sponsors also face digital performance challenges
Dynatrace also analyzed the performance of World Cup-specific campaign pages from 21 official FIFA World Cup 2026™ sponsors, revealing similarly wide differences across sectors including retail, hospitality, automotive, financial services, and food and beverage.
Retail and consumer service sponsor campaign pages recorded the slowest average load times at 14.6 seconds, followed by hospitality and travel brands at 12.0 seconds. In contrast, automotive sponsors delivered the fastest average performance at 3.4 seconds, ahead of consumer goods and apparel brands at 3.6 seconds.
(Average page load time)
| Ranking | Sponsor sector | Average page load time |
| 1 | Retail & Consumer Services | 14.6 seconds |
| 2 | Hospitality, Travel & Leisure | 12.0 seconds |
| 3 | Technology & Telecommunications | 7.1 seconds |
| 4 | Energy & Utilities | 6.7 seconds |
| 5 | Financial Services | 5.8 seconds |
| 6 | Food & Beverage | 5.8 seconds |
| 7 | Consumer Goods & Apparel | 3.6 seconds |
| 8 | Automotive | 3.4 seconds |
As organizations prepare for high-traffic global events, such as the World Cup, they need to ensure they have the ability to continuously monitor and analyze digital performance, enabling teams to quickly identify issues and optimize experiences in real time so that customers have a seamless experience.
“Global sporting tournaments create huge spikes in digital traffic and major opportunities for brands to engage fans across multiple digital touchpoints, from viewing fixtures and live match updates through to social campaigns, promotions and branded content,” said Bob Wambach, VP, Market and Customer Insights, Dynatrace. “Fans now expect fast, seamless and always-on digital experiences wherever they interact online, but our analysis shows there is still a significant gap in digital readiness across the websites of participating nations and sponsors. Even small delays during peak moments can impact fan engagement, online revenue and brand reputation, which is why federations and sponsors cannot afford to overlook digital performance during the World Cup.”
Methodology
Dynatrace analyzed synthetic monitoring data from official football federation websites associated with all 48 participating FIFA World Cup 2026™ nations, alongside World Cup-specific campaign pages from 21 official tournament sponsors.
Sponsor campaign pages were grouped into broader industry categories, including retail, hospitality, food and beverage, financial services, automotive, technology and telecommunications, to identify wider digital performance trends during major sporting-event campaign activity.
Average total page load times were measured in seconds over a seven-day monitoring period in May 2026.
Media Contact: